New York City Taxi & Limousine Commission (TLC) - Data Visualization Suite
Professional visualizations for fare prediction analysis and operational insights
CASE STUDY
4 min read
NYC TLC Fare Prediction & Ridership Analysis
Exploratory data analysis and visualization to support fare estimation modeling and operational insights.
Business Context / Overview
Background:
Automatidata is a data consulting firm specializing in transforming unused data into business solutions. The firm is consulting for the New York City Taxi and Limousine Commission (TLC), responsible for licensing and regulating NYC's 200,000+ taxi cabs and for-hire vehicles.
Why this analysis was required:
To develop a regression model that estimates taxi fares before rides, based on historical trip data. This will help TLC improve fare transparency, customer satisfaction, and operational efficiency.
Who benefits:
NYC TLC Operations & Finance Departments
Taxi drivers and fleet operators
NYC residents and visitors through more predictable pricing
Automatidata's data consulting team
Problem Statement
The NYC TLC lacks a reliable, data-driven method to estimate taxi fares in advance. Without accurate fare prediction, passengers face pricing uncertainty, drivers experience income variability, and the commission struggles with fare dispute resolutions. Current manual estimation methods are inconsistent and don't account for temporal, geographical, and trip-specific factors.
Objectives
Analyze historical trip patterns to identify key fare determinants
Examine temporal patterns (monthly, daily, hourly) in ride volumes and revenues
Investigate trip characteristics (distance, duration, passenger count) and their relationship to fares
Identify outliers and data quality issues that could impact model accuracy
Create accessible visualizations for both technical and non-technical stakeholders
Dataset Description
Source: NYC TLC 2017 Yellow Taxi Trip Data (2017_Yellow_Taxi_Trip_Data.csv)
Records: 22,699 taxi trips
Features: 18 original columns including:
trip_distance, fare_amount, total_amount
tpep_pickup_datetime, tpep_dropoff_datetime
passenger_count, PULocationID, DOLocationID
tip_amount, tolls_amount, improvement_surcharge
Derived: trip_duration, month, day_of_week
Time Period: 2017 calendar year
Data Preparation & Cleaning
Converted datetime columns to proper datetime format
Created derived features: trip duration, month, day of week
Handled zeros in passenger_count (33 rides with 0 passengers flagged for investigation)
Assessed outliers in trip_distance, total_amount, and tip_amount
Validated data completeness - no missing values in key columns
Checked for data type consistency across numerical and categorical variables
Exploratory Data Analysis (EDA)
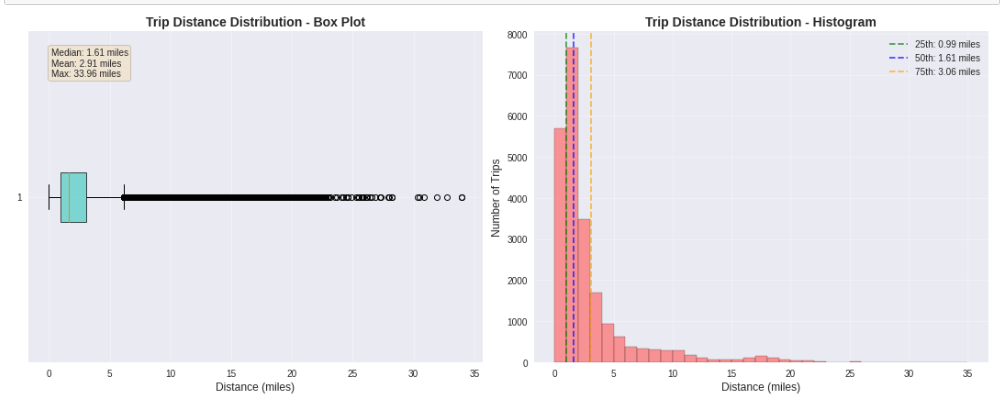
Trip distance distribution: Majority under 5 miles, right-skewed with outliers to 34 miles
Temporal analysis: Monthly and daily patterns in ride volume and revenue
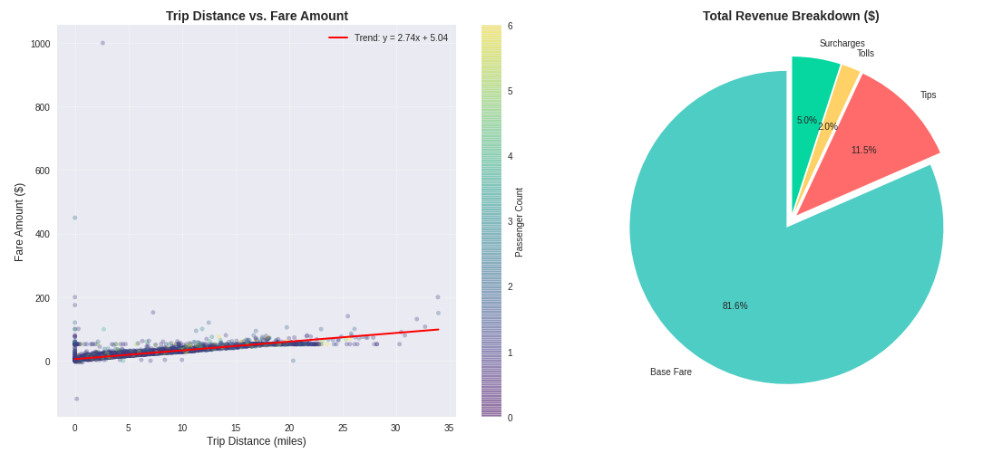
Fare composition: Breakdown of base fare, tips, tolls, and surcharges
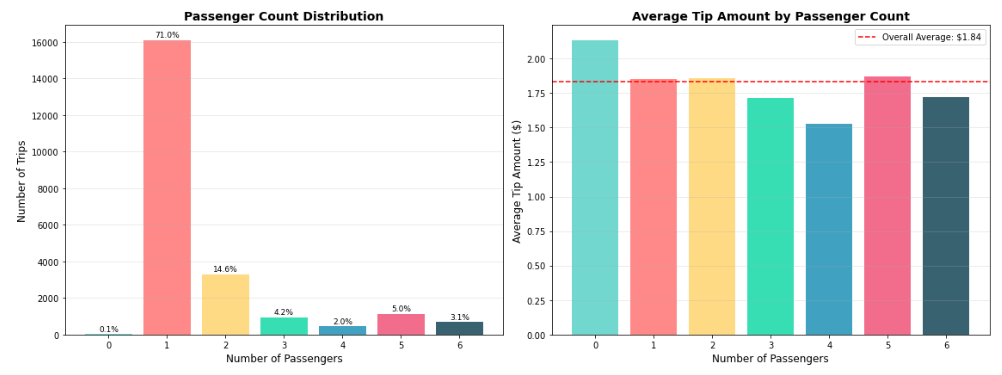
Passenger analysis: Relationship between passenger count and tip amounts
Geographic patterns: Drop-off location distribution and trip distance by location
Vendor comparison: Trip distribution between two taxi vendors
Analytical Approach
Statistical summaries using .describe() and .groupby()
Distribution analysis via histograms and box plots
Temporal trend analysis using time-series aggregation
Comparative analysis between vendor performance
Correlation analysis between distance, duration, and fare amount
Outlier detection using IQR method for trip distances and fare amounts
Key Insights
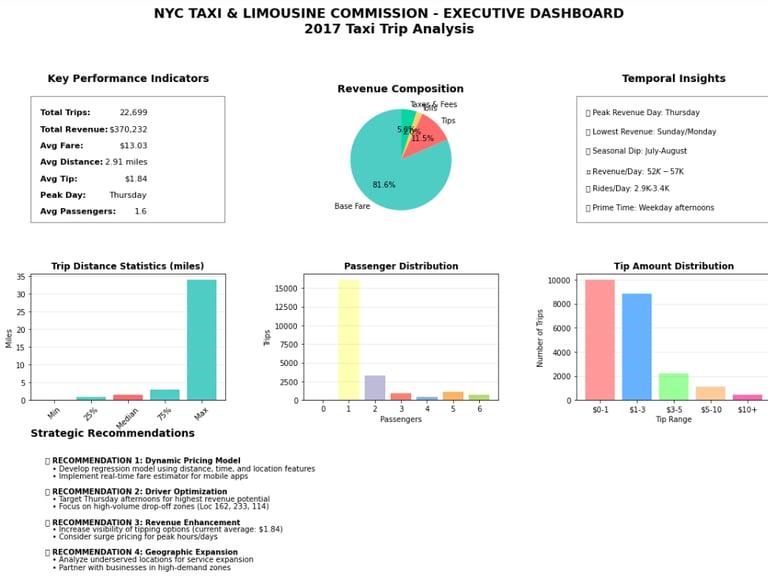
Most trips are short-distance: 75% of trips are under 3.06 miles
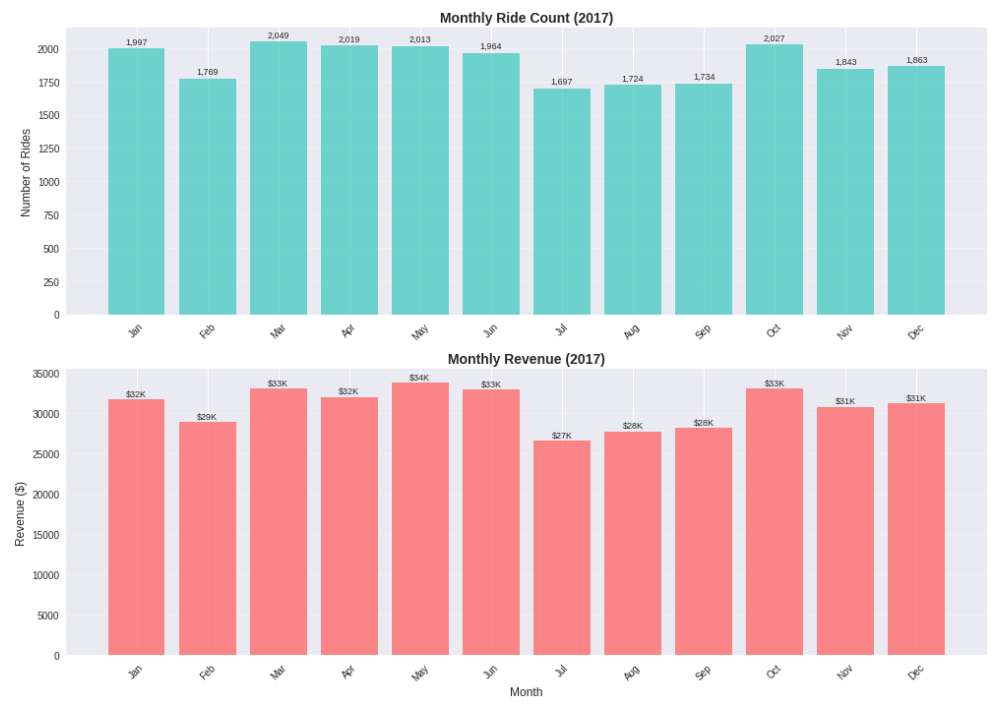
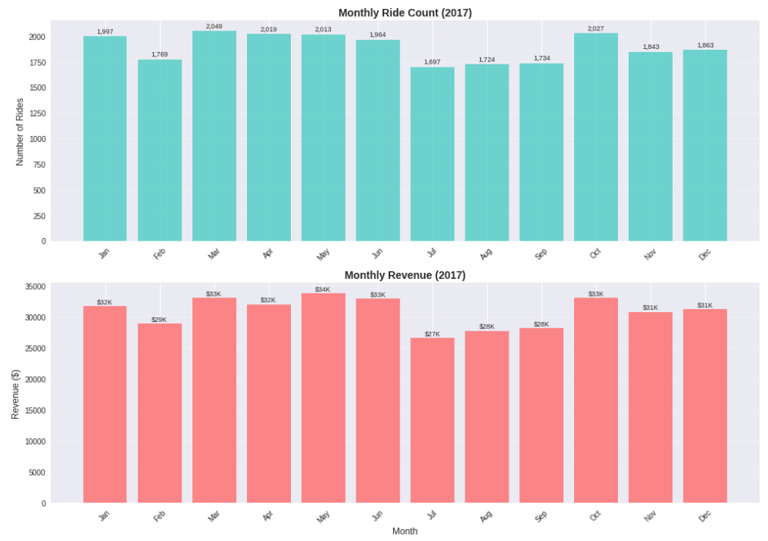
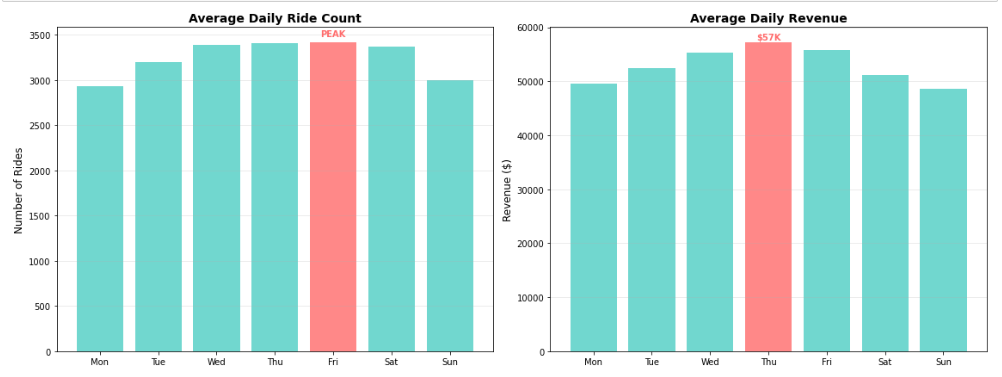
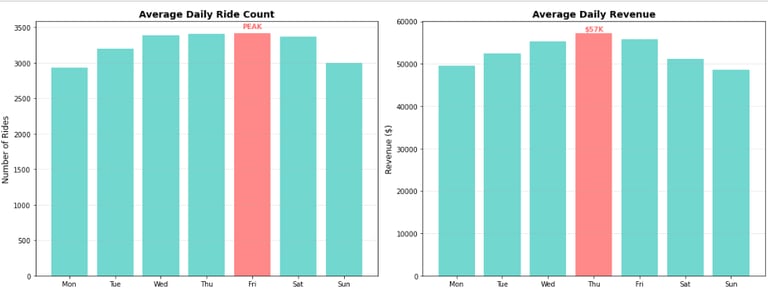
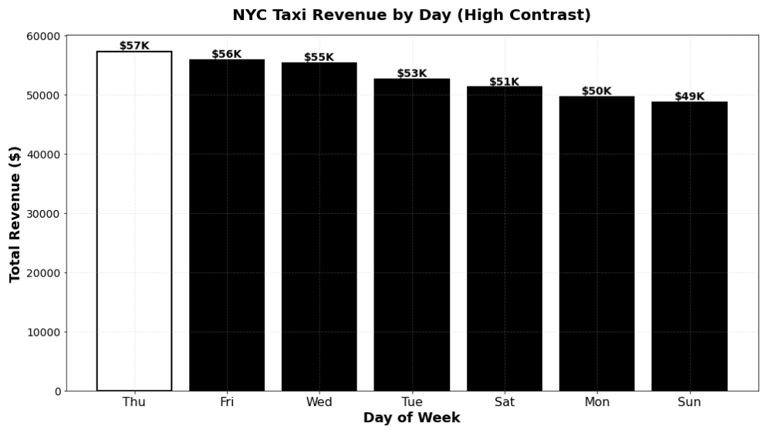
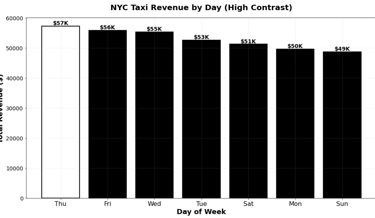
Temporal patterns: July-August show ride dips; Thursday has highest revenue
Fare determinants: Distance shows strongest correlation with total fare
Tip patterns: Majority of tips are $0-3, with consistent distribution across vendors
Passenger behavior: Single passengers dominate (71% of trips), but don't tip significantly more
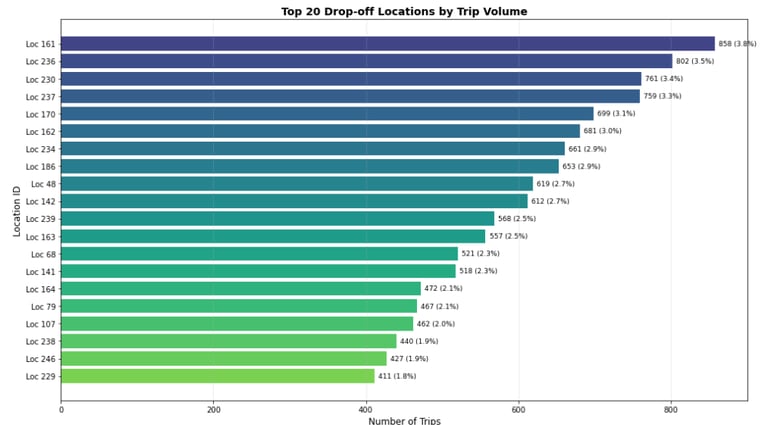
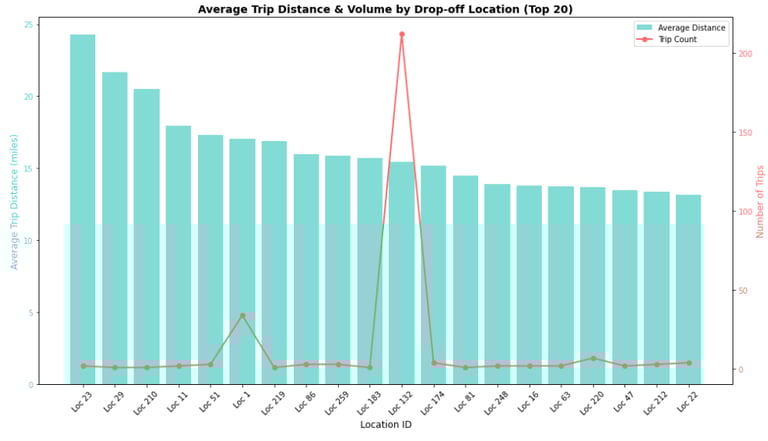
Geographic distribution: Drop-off locations are evenly distributed, but traffic concentrates at popular locations
Visualizations & Reporting
Python (Matplotlib/Seaborn):
Box plots for trip distance and fare outliers
Histograms for distance, fare, and tip distributions
Bar charts for monthly/daily ride counts and revenue
Comparative plots for vendor performance
Geographic analysis via drop-off location distributions
Trip Distance Distribution - Box Plot & Histogram:
Fare Amount vs Trip Distance - Scatter Plot:
Monthly Ride Count & Revenue:
Daily Patterns - Ride Count & Revenue:
Passenger Count Distribution & Impact on Tips:
Top 20 Drop-off Locations by Trip Volume:
Distance by Drop-off Location:
Comprehensive Overview for Management:
Accessibility-Friendly Version:
For stakeholders with visual impairments
Tools & Tech Stack
Language: Python
Libraries: Pandas, NumPy, Matplotlib, Seaborn, datetime
Environment: Jupyter Notebook
Visualization Tool: Tableau Public
Data Storage: CSV
Challenges & Limitations
Limited geographic context: Location IDs without coordinates
Data representativeness: Sample may not reflect full year patterns
Zero-passenger rides: 33 trips with 0 passengers require investigation
Vendor data imbalance: Uneven distribution between two vendors
Seasonal coverage: Potential gaps in monthly representation
Results & Business Impact
Clear fare determinants identified: Distance as primary predictor
Temporal patterns documented: Peak revenue days identified (Thursday)
Data quality assessment: Outliers and anomalies flagged for review
Visual foundation established: Dashboards for ongoing monitoring
Model readiness: Features identified for regression modeling
Operational insights: Low-utilization periods identified for optimization
Recommendations
Develop regression model using trip_distance, temporal features, and pickup/drop-off zones
Implement real-time fare estimator for mobile apps and taxi meters
Create driver guidance system for high-revenue time/location targeting
Establish data quality monitoring for zero-passenger and outlier trips
Expand geographic analysis with coordinates for pickup/drop-off locations
Develop seasonal adjustment factors for fare prediction model
Key Learnings
Urban mobility patterns show clear temporal and spatial concentrations
Fare structure transparency is critical for customer trust and satisfaction
Data quality vigilance is essential when working with operational systems
Accessible visualization enables broader stakeholder engagement
Feature engineering (trip duration, temporal features) adds significant predictive power
Project Status
Status: ✅ EDA Phase Completed
Ready to transform your transportation data into actionable insights?
Let's build data-driven solutions that move your organization forward.