📊 Data Analysis Case Study: TikTok Claim vs Opinion Video Classification.
TikTok’s mission is to inspire creativity and bring joy. With millions of user-generated videos, the platform receives a high volume of user reports flagging content as “claims” (factual assertions) or “opinions.” Moderators face a growing backlog, slowing response times and affecting user trust.
2/8/20263 min read
Exploratory data analysis and visualization to support automated content moderation.
Business Context / Overview
Background:
TikTok’s mission is to inspire creativity and bring joy. With millions of user-generated videos, the platform receives a high volume of user reports flagging content as “claims” (factual assertions) or “opinions.” Moderators face a growing backlog, slowing response times and affecting user trust.
Why this analysis was required:
To build a predictive model that automatically classifies videos, reducing manual review time and improving moderation efficiency.
Who benefits:
TikTok’s Content Moderation Team
Data Science and Operations Teams
End-users through faster, more accurate content handling
Problem Statement
TikTok’s manual review process for user-reported videos is inefficient and unsustainable due to volume. Without a clear, data-driven understanding of what distinguishes a “claim” from an “opinion,” the team cannot build an accurate classification model, leading to delayed moderation, potential misinformation spread, and user dissatisfaction.
Objectives
Perform comprehensive EDA to uncover patterns in video metrics between claims and opinions.
Identify key distinguishing features (e.g., view count, author status, engagement metrics) that could predict video type.
Deliver clear, accessible visualizations for both technical and non-technical stakeholders.
Prepare clean, analysis-ready data for future machine learning modeling.
Dataset Description
Source: Internal TikTok dataset (tiktok_dataset.csv)
Records: 19,382 videos
Features: 12 columns including:
claim_status (claim/opinion)
video_view_count, video_like_count, video_share_count
author_ban_status, verified_status
video_duration_sec, video_transcription_text
Time Period: Not specified (static snapshot)
Data Preparation & Cleaning
Handled missing values in claim_status and engagement metrics.
Verified and corrected data types for numerical vs. categorical fields.
Assessed outliers using IQR and median-based thresholds.
Standardized column names and ensured consistent formatting.
Exploratory Data Analysis (EDA)
Distribution analysis of video duration, views, likes, shares, downloads, and comments.
Comparison of claims vs. opinions across verified status and ban status.
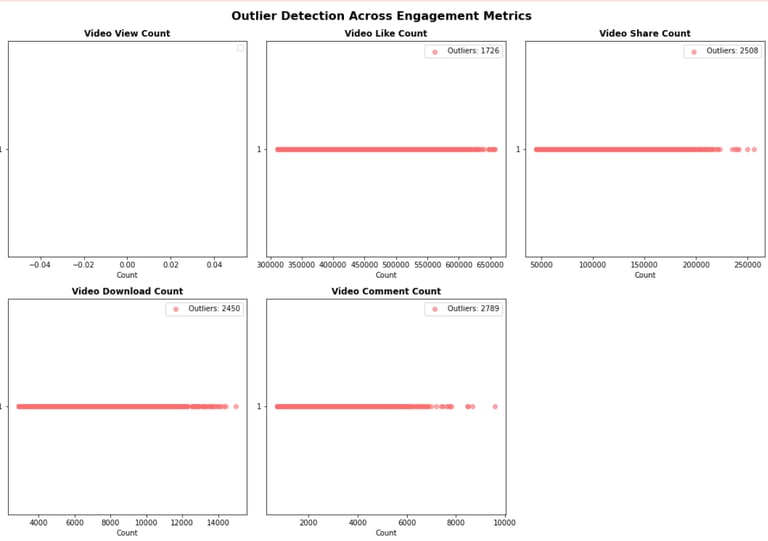
Outlier detection for engagement metrics using non-parametric methods.
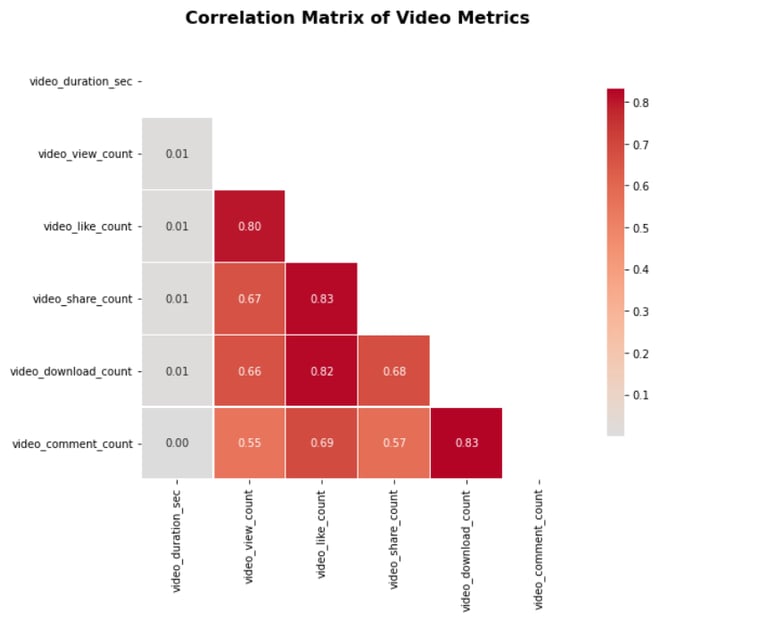
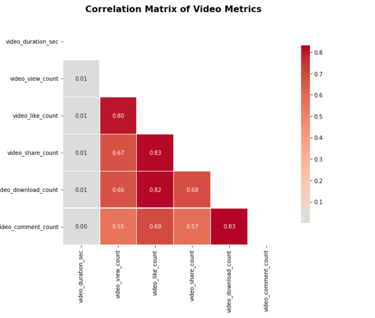
Correlation exploration between view count, likes, and claim status.
Analytical Approach
Statistical summaries using .describe() and .groupby() methods.
Visual distribution checks via boxplots and histograms.
Segmentation analysis by author ban status and verification status.
Threshold-based outlier identification using median + 1.5 * IQR.
Key Insights
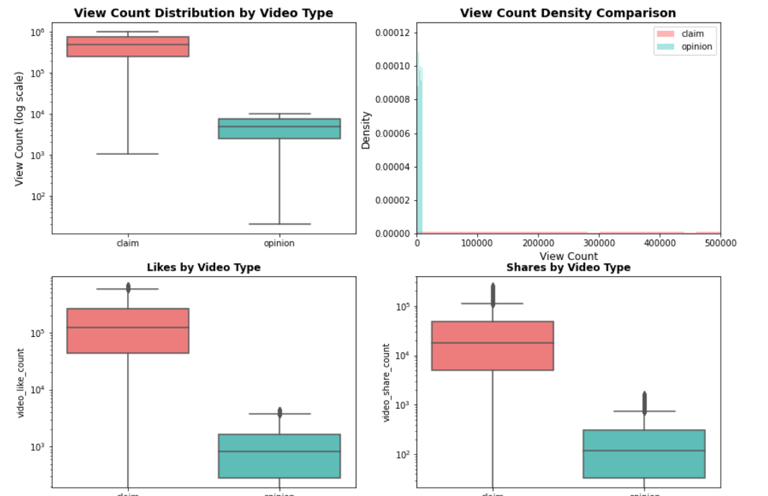
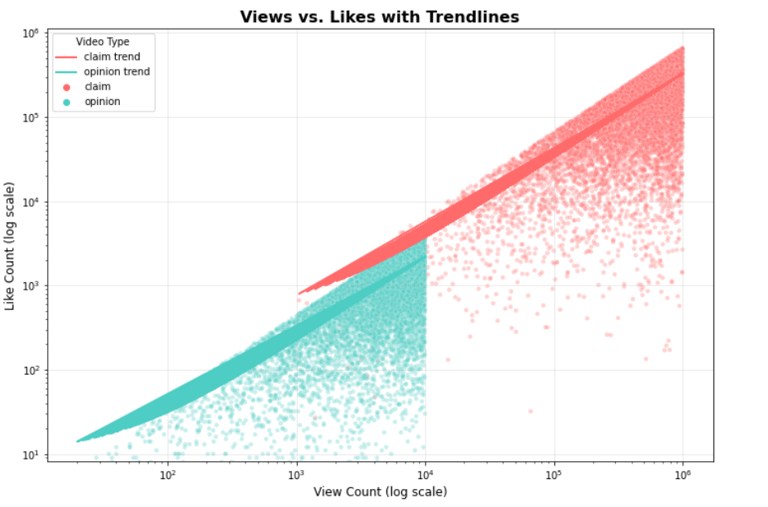
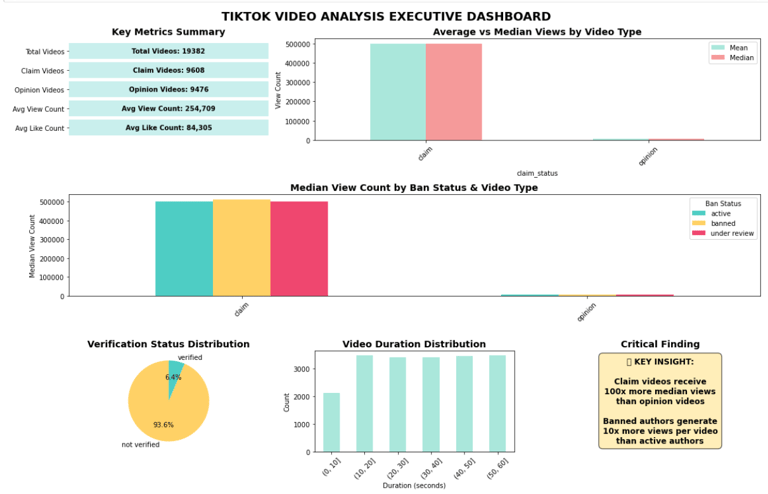
Claim videos receive significantly higher median views (~501k) compared to opinion videos (~4,953).
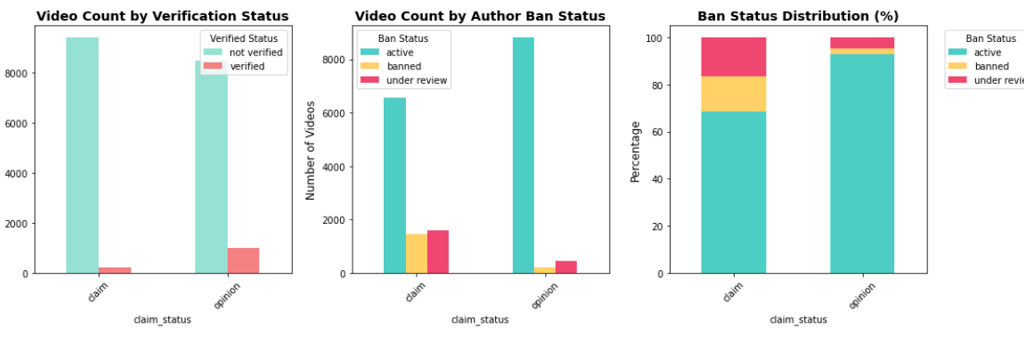
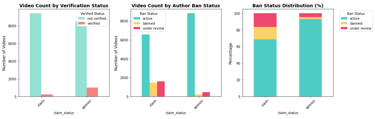
Verified users are more likely to post opinions, while unverified users post more claims.
Authors under review or banned post more claim videos and receive disproportionately high view counts.
Engagement metrics (likes, shares, downloads) are highly right-skewed, with a small percentage of videos driving most engagement.
Visualizations & Reporting
Python (Matplotlib/Seaborn):
Boxplots & histograms for all key metrics
Claim vs. opinion bar charts by author status
Scatter plots of views vs. likes colored by claim status
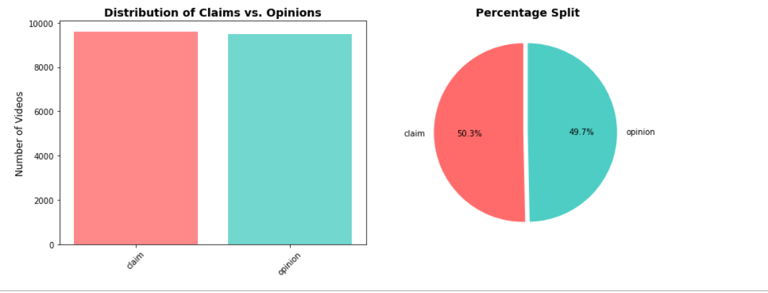
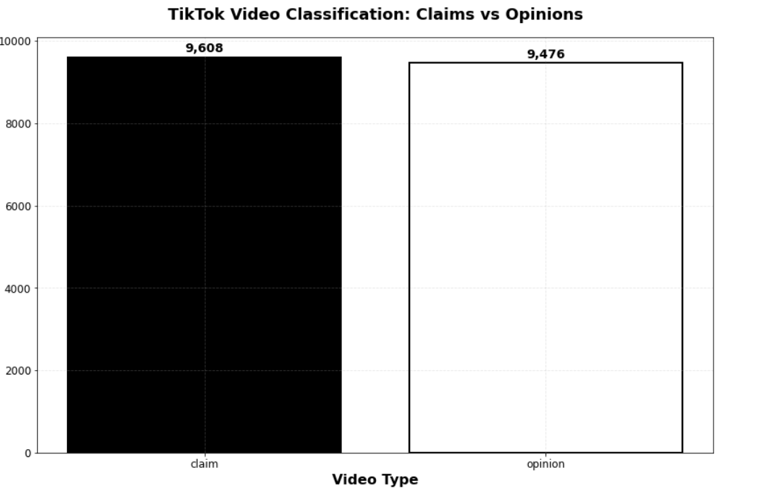
Video Type Distribution:
What percentage of videos are claims vs. opinions?
Engagement Metrics Analysis:
View Count Distribution by Video Type
Author Status Breakdown:
Correlation And Relationship Analysis :
Correlation Heatmap
Views vs Likes Scatter with Trendline:
Outlier Analysis:
Outlier Detection Across Metrics
Summary Dashboard:
Executive Summary Visualization
Accessibility-Friendly Version:
For stakeholders with visual impairments
Tools & Tech Stack
Language: Python
Libraries: Pandas, NumPy, Matplotlib, Seaborn
Environment: Jupyter Notebook
Visualization Tool: Tableau Public
Data Storage: CSV
Challenges & Limitations
Highly skewed engagement data required non-standard outlier treatment.
Missing values in key columns reduced usable sample size.
Text data (video_transcription_text) was not analyzed in this phase.
Domain knowledge required to interpret “ban status” and “verified status” accurately.
Results & Business Impact
Clear feature understanding now guides model feature selection.
Stakeholder alignment achieved through accessible Tableau dashboards.
Moderation team can now prioritize videos based on risk indicators (e.g., high-view claims from unverified authors).
Data pipeline readiness for building a classification model.
Recommendations
Build a binary classification model using view_count, author_ban_status, and verified_status as top features.
Implement automated outlier flagging for viral content to prevent model bias.
Expand analysis to text data (NLP) for transcription-based classification.
Create real-time dashboards for ongoing monitoring of claim vs. opinion trends.
Key Learnings
Business context is critical—understanding TikTok’s moderation needs shaped the analysis direction.
Right-skewed social media data requires tailored statistical approaches.
Visualization accessibility ensures insights are actionable for all stakeholders.
Clean, documented EDA accelerates downstream modeling and decision-making.
Project Status
Status: ✅ Completed